Beantwoord

Experiencing lag while gaming and in online calls. How to fix bufferbloat on my Experiabox V10?

  • 7 October 2021
  • 1 reactie
  • 386 keer bekeken

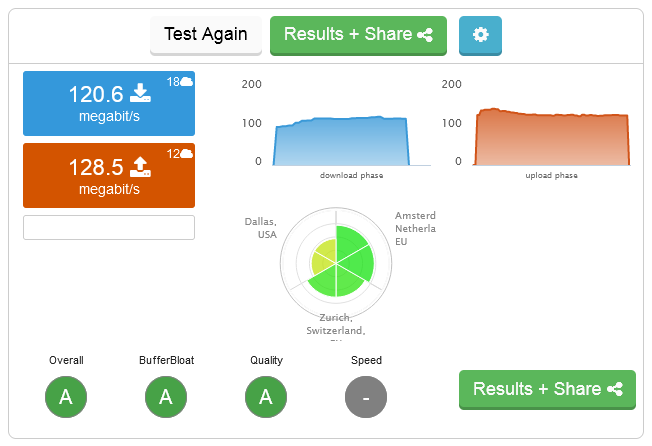
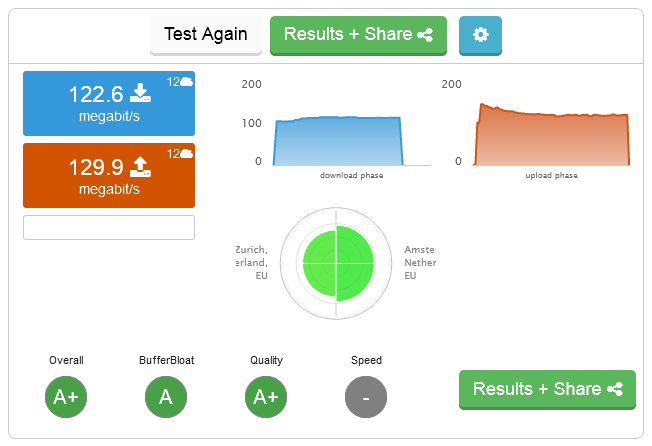
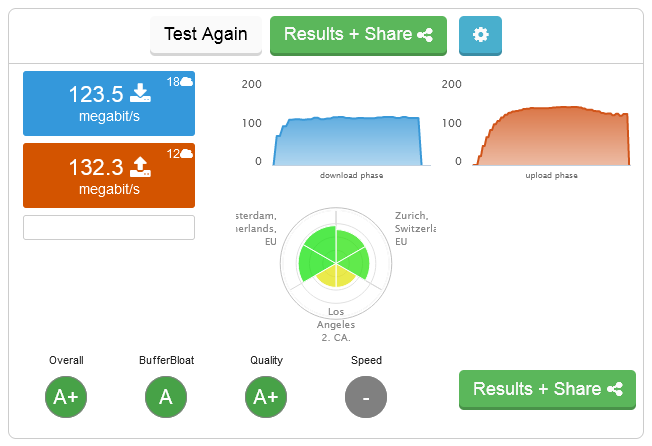
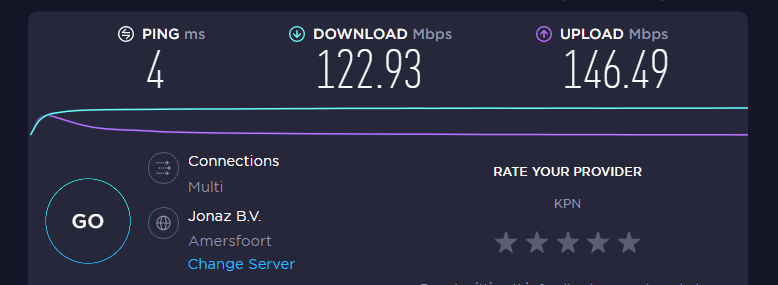
Recently I started experience bad lag while being on online calls and while playing video games. I called in a specialist from KPN and they changed the modem to an experia box v10 and said that it should be fixed and work way better. All was well for about a day and then everything went back to being bad. After I've done my own research, I've concluded that it's due to bufferbloat. I'm not sure if this router has an SQM feature, so I'm wondering if there's any way to fix it.

icon

Beste antwoord door Babylonia 7 October 2021, 05:16

Bekijk origineel

Dit topic is gesloten. Staat je antwoord hier niet bij, gebruik dan de zoekfunctie van de Community of stel je vraag in een nieuw topic.

1 reactie

Reputatie 7
Badge +10

Recently I started experience bad lag while being on online calls and while playing video games.
……..
I've concluded that it's due to bufferbloat.
I'm not sure if this router has an SQM feature, so I'm wondering if there's any way to fix it.

In what I can remember I thought “NO”.  (I am not using the V10 yet). Just search into menu's.
At least “if” you can find some settings, just some very basic options I guess.

But I wonder if testing by “bufferbloat” will give you good insight anyway?
There are some “bufferbloat” resources as for testing. E.g. referring to:
https://www.bufferbloat.net/projects/bloat/wiki/Tests_for_Bufferbloat/

But doing some testing I come to the conclusion that every result do have their own variation not dependant due to modem/router models.  Related to e.g.:

  • Which PC you are testing → not using other devices during a test
    (as you are writing doing online calls while playing video games).
  • Which web browser using for a test.
  • External factors by public internet network in general.
    → each test can make use of different servers, not only by regions nearby,
        but what is the use by choosing a server thousands miles away ??
  • Slow down / “capping” internet speed by ISP already, as the technical possibilities
    can be far more speedy, than what a user is willing tot pay for an internet subscription.
    E.g. my internet account is based to a 100/100 Mbps fibre connection.
    The real technical speed however could be about 1 Gbs (minus some overhead).
  • General precausation by ISP's and back bone servers to prevent congestion of data flow.

E.g. I am using my own router, having possibilities for tweaking control of data traffic.
But it doesn't give that big differences by e.g. using my own settings as for “capping” / regulating data, and what the ISP already is doing to keep my speed to the speed of my internet subscription.


Some examples using the following test. Using “Firefox” as a web browser.
As e.g. Google Chrome often a test doesn't finish at all.   Speedtest + bufferbloat test:
http://www.dslreports.com/speedtest

Test 1.       NOT enabled settings within my router as for control of data traffic.
Speed test as by this website specially the second part of the test “uploading” (upload phase), the shape / values of speed shall be starting at much more high speed first, lowered afterwards by the artificial slowing down / “capping” internet speed by ISP to my internet subscription.


A second test, a USA server is not taken into account now. (Why ??)
The more high speed in the beginning as for “upload phase” is even more clear.


Test 2.       ENABLED settings within my router as for control of data traffic.
See the different shape as for “upload phase”. Beginning more low speed, and going more up.
The average speed at the end as a result however is just a tiny bit better.


“Ookla”
Comparable speed testing done by the often used “Ookla” speedtest website.
But this time using “Chrome web browser”, as this do give more stable results.
(There is also an option downloading a speed test utility, not using web browser based resources).
https://www.speedtest.net/

Only using one server nearby in The Netherlands for testing.

See the different shapes of the purple uploading curve.

Test 1.       NOT enabled settings within my router as for control of data traffic.
As a remark.  Not seen that well in the graph itself as the end result is just the average speed,
but during testing itself, by the round speed clock, the upload speed in the very beginning do start at very high levels above 900 Mbps, to slow down in 2-3 seconds to a more steady speed “capped”.


Test 2.       ENABLED settings within my router as for control of data traffic.


As a general remark. The settings used in my router as for control of data traffic are tweaked by such values, that a speed test by Ookla is giving the most high “end” result as for average speeds.
Values = capped to lower speeds than maximum “technical” 1 Gb network connection itself.
But set about 20 Mbps more high than my most normal maximum found average speeds.

(Besides some guaranteed “fixed” values as for some kind of devices and/or used data traffic use, as e.g. “SIP” data, and “RTP” IPTV data).